I’ve had a goal of creating a detailed US Chaseability map for a couple years now. I wanted to factor in road grid, tree density and terrain. I’ve made progress on the first two items, and it’s at a point now where it should help inform my chase planning this year. I wanted to share in case anyone else finds it helpful. (For chasers that dwell and chase frequently in the central US, this might be superfluous :) )
My intention for it is to frame what I might expect and be ready for during a chase, or possibly inform my targeting decisions (all other thing being equal).
Please also note that I have not completed road network analysis on Wisconsin, Indiana, Michigan, Ohio, Florida, and Mississippi River Valley (see future plans at bottom of this post).
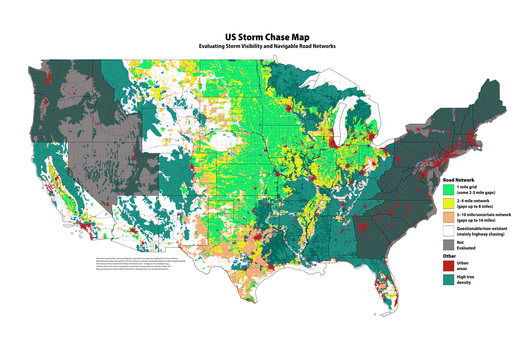
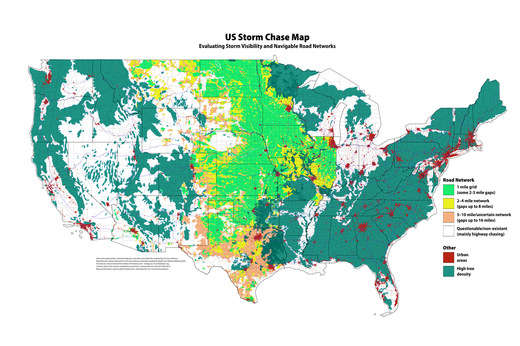
US Storm Chase Map - with forested areas
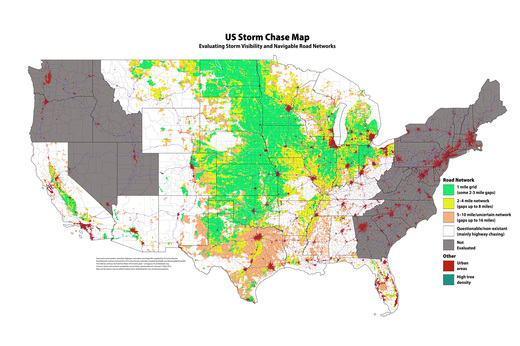
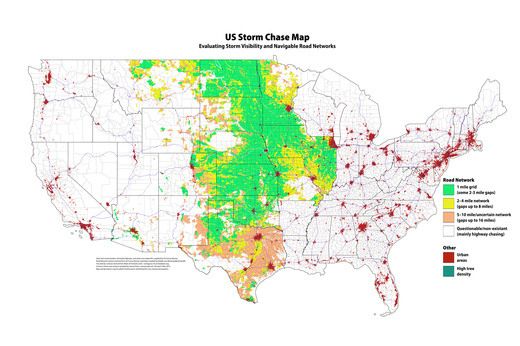
US Storm Chase Map - without forested areas
I want to make this available as a resource to the storm chasing community. If you are interested in editing or adding content to the layered PSD file, please let me know and I can provide a download link. It is too big—150MB—to provide an ongoing public link (my web host would probably threaten to terminate my account if I did that). If anyone wants to do their own work on it, I’d just ask that any copies or derivatives of this content be re-distributed non-commercially. I can be reached at the email address in the header of this blog.
Details
Road grid quality
- Green = Typically 1 mile grid with some 2-3 mile gaps
- Yellow = Typically 2-4 mile network with some 8 mile gaps / 1-2 mile network with discontinuous junctions
- Orange = Typically 5-10 mile network/uncertain network with gaps up to 16 miles
- Empty = Questionable or non-existant. Mainly highway chasing.
Tree Density
Contour of areas with highest tree density.
Urban Areas
Highlighted in dark red.
Caveats
- This is not intended as a tactical navigation resource. It is meant to provide a strategic overview of chase navigability/storm visibility.
- Road grid quality does not speak to actual road conditions—mud bogs, sand traps, plowed-over roads, and map mirages.
Map choice
To avoid copyright issues, I took my first dip into working with shapefiles from the US Census Bureau using QGIS on the Mac to convert to DXF and then import into Illustrator. This provided vector data I could use to add county and state boundaries, interstate paths, and urban areas.
I chose a map projection for the data that was compatible with Google Maps mercator projection (EPSG:900913). This aligned with the road network resource I used and the default projection at Data Basin.
Road Network Method
The US Census Bureau provide shapefiles for all roads in the US, but the number of shapefiles is enormous (3200+) and without scripting would be an extremely tedious process. However, reddit user, WestCoastBestCoast94, did go through this process and used the data to generate a high-res PNG image of all roads in the US. I referenced this image to make estimates of road networks and to draw in boundaries. I gave preference to networks with primarily straight roads and perpendicular intersections. There may be decent networks with lots of diagonal roads and angled intersections (I’m looking at you, Texas), but without a more detailed & lengthy examination, I can’t tell which of these are halfway-decent and which are terrible, so I tended to leave them in the lower quality buckets.
I did not have an eternity to do this, so there is going to be some slop in places—taken as a whole, it should provide a reasonable estimate of road network. However, DeLorme, Garmin, Google, Yahoo, Microsoft, whatever map software of your choice, would still need to be the prime resource for current/reasonably-accurate info.
I am not including the actual road-network map in the image above or in the layered PSD file, because I don’t know if ‘WestCoastBestCoast94’ wanted it to be re-distributed in a Creative Commons non-commercial sense. However, you can find his US map and more detailed individual state maps in the directory he created here: http://foid.me/roads/. It is scaled such that you could paste it into the layered PSD document to compare to contours I’ve drawn.
Tree Density Method
I used the ‘Mask Of Forested Lands Contiguous US’ data from Data Basin to draw contour lines around the areas of highest tree density. There are less dense tree signals that I did not include in the boundaries. I am also not sure how well the data correlates to the real world and whether it includes other annoying, visibility-killing plant life.
Future Plans & Possibilities
- Road Network: Add contours for California, Wisconsin, Indiana, Michigan, Ohio, Florida and Mississippi River Valley.
- Evaluate color choices for accessibility and easy evaluation of features (it's probably pretty bad for deuteranopes at this point).
- Terrain: flat / hilly (maybe 2 or 3 degrees of this?) / rugged / mountainous — with obstructions (rivers/escarpments)
- River crossings
- Hostile counties: I’m collecting a list (e.g., Barber Cty, KS)
- Rest Stop/Boondocking locations