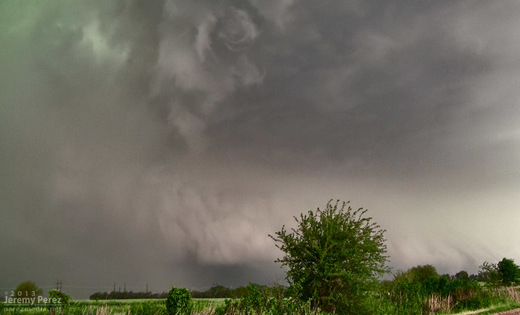
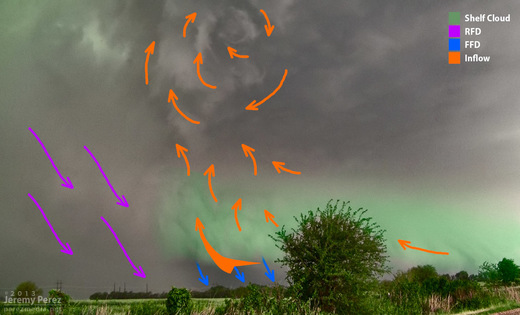
In my previous post, I diagrammed the Oxford, Kansas supercell from 19 May 2013. About 90 seconds after that shot was taken, a new area of low level rotation developed just ahead of the occlusion. This is a diagram of that moment as the inflow was forced into the updraft at that point and rapidly exposing circulation at the cloud base.
Search
About this Entry
This page contains a single entry by Jeremy Perez published on January 11, 2015 9:22 PM.
On the Continuum of Walls and Shelves was the previous entry in this blog.
Storm Chase Forecast — 19 March 2015 is the next entry in this blog.
Find recent content on the main index or look in the archives to find all content.
Pages
Categories
- Funnel (10)
- Funnel Cloud (6)
- General (1)
- Geology (9)
- Field Trip (1)
- Fluorescent (3)
- Fossils
- Pelecypods
- Petrified Wood
- Minerals (7)
- Agate
- Amethyst
- Calcite (1)
- Magnetite (5)
- Quartz
- Siderite
- Meteorology (48)
- Optics (2)
- Supercell (26)
- Tornado (5)
- Wildfire (1)
- Science (1)
- Southwest Monsoon (10)
- Storm Chase Summary (31)
- Storm Chasing (18)
- Storms (39)
Monthly Archives
- March 2016 (1)
- January 2016 (6)
- October 2015 (1)
- August 2015 (4)
- May 2015 (2)
- April 2015 (1)
- March 2015 (1)
- January 2015 (1)
- December 2014 (1)
- October 2014 (1)
- September 2014 (1)
- July 2014 (1)
- May 2014 (7)
- April 2014 (8)
- December 2013 (1)
- September 2013 (1)
- June 2013 (1)
- March 2013 (2)
- October 2012 (1)
- July 2012 (1)
- April 2012 (1)
- March 2012 (2)
- February 2012 (5)
- October 2011 (1)
- September 2011 (1)
- May 2011 (1)
- October 2010 (1)
- September 2010 (1)
- August 2010 (1)
- June 2010 (6)
- December 2009 (2)
- September 2009 (1)
- August 2009 (3)
- July 2009 (6)


